
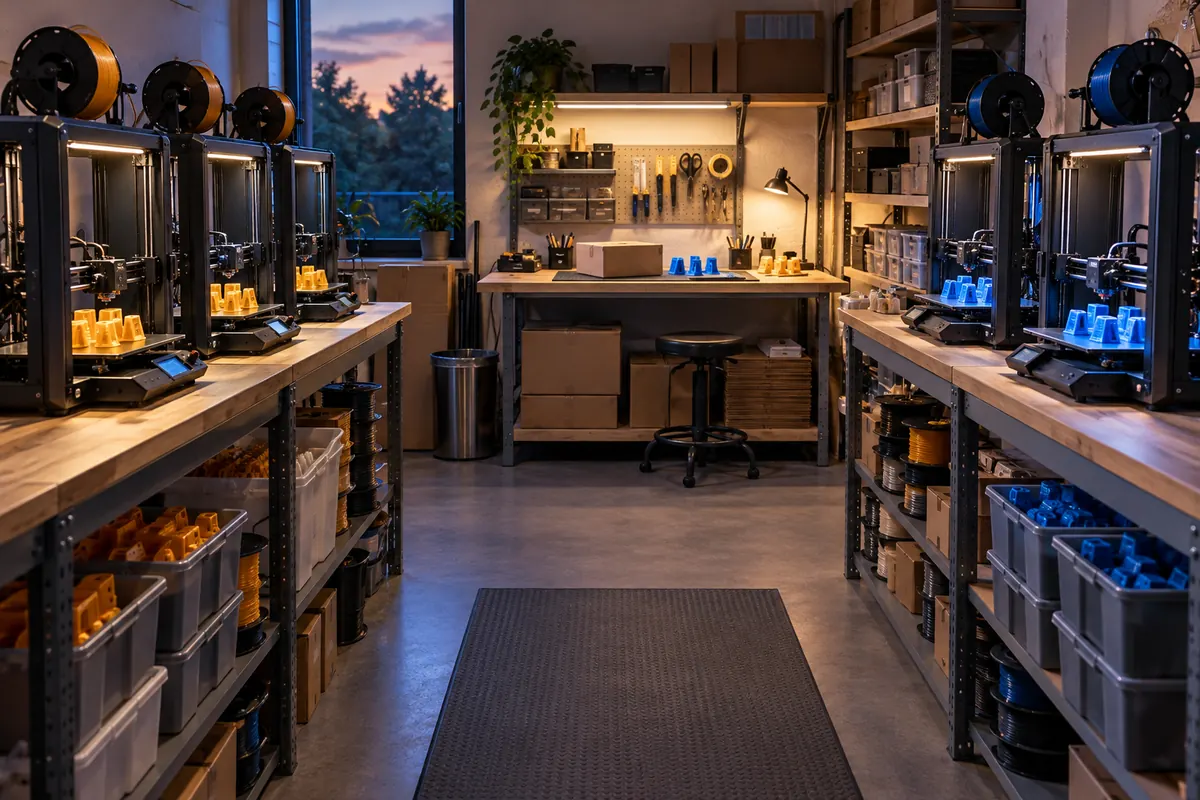
Technical context
Build a monthly contribution model and a separate cash-flow view. Include downtime, accepted yield, operator availability and order mix. Payback on a printer purchase differs from recurring operating break-even; both need their own time boundary and cost basis.
Contribution toward fixed costs
View data table
| Comparison | € |
|---|---|
| 50 jobs | 400 |
| 100 jobs | 800 |
| 150 jobs | 1200 |
Practical workflow
Before expanding, test whether incoming profitable orders exceed current capacity. A machine waiting for work has low energy cost but still ties up capital and space. Use optimistic and cautious utilization cases, with assumptions visible rather than a guaranteed profit claim.
Calculation and units
Contribution = price ? variable cost; break-even = ceil(fixed cost/contribution). Nonpositive contribution cannot cover fixed costs by increasing volume.
Worked example
600 monthly fixed costs, price 20 and variable cost 8 give contribution 12 and 50 break-even units. Four hours each need 200 productive hours before reprints.
Validate the outcome
Check required hours against available productive capacity. Avoid duplicating fixed depreciation in variable hourly costs.
Separate demand, capacity and yield
Calculate theoretical hours from machine count and the intended schedule, then subtract planned maintenance and realistic unavailable time. Apply the accepted-job yield model separately: a machine occupied by a failed job consumed capacity without producing a sellable unit. Finally cap the plan by profitable demand rather than assuming every available hour will be sold.
Ten printers with two hundred planned hours each do not automatically supply two thousand billable hours. An operator may not be able to remove, inspect and restart every job quickly enough. Quoting and customer service can also interrupt production. Record the limiting resource and evaluate the product mix against it before using printer count as a profitability proxy.
Break-even and investment payback differ
Operating break-even asks whether contribution covers recurring fixed expenses during a defined period. Investment payback asks when cumulative cash returns recover the initial investment. Adding the full purchase price to every month's operating expense confuses the two. Conversely, excluding every replacement or capital allocation can make an operating estimate look artificially strong over the long term.
In a hypothetical farm with fixed monthly cost 600 and contribution 12 per accepted unit, fifty units cover the modeled fixed cost. At seventy units, contribution is 840 and operating surplus under this boundary is 240. Recovering an initial 4,800 investment from that surplus would take twenty months if everything stayed constant, an assumption that must be shown rather than guaranteed.
Stress-test before buying another printer
Build a cautious scenario with lower demand, more downtime and longer finishing time, then an expected scenario based on actual order history. Do not increase demand merely because another printer becomes available. If both scenarios point to an operator bottleneck, better fixturing, easier support removal or standardized packing may offer more useful capacity than additional machines.
Use contribution per constrained hour to compare jobs. A job contributing 15 in one machine hour can be more attractive than one contributing 30 in five hours when printers are fully booked. If handling is the bottleneck, compare per operator hour instead. The relevant ratio changes with the bottleneck, so preserve the reasoning behind your scheduling policy.
Contribution example
| Monthly units | Contribution at12/unit | Surplus after600 fixed |
|---|---|---|
| 30 | 360 | ?240 |
| 50 | 600 | 0 |
| 70 | 840 | 240 |
Compare contribution per bottleneck hour
With printers fully booked, a job contributing 15 in one machine hour can outperform one contributing 30 in five hours. If handling is the bottleneck, operator-hour contribution is the relevant comparison instead. Build a constrained schedule from actual order demand and labor, then include reprints and maintenance. A theoretical utilization percentage cannot substitute for a queue of profitable accepted orders or evidence that staff can finish them.
Does another printer immediately increase profit?
Only when profitable demand and the other required resources can use its capacity. If quoting, removal or finishing already limits output, another machine can increase capital and space costs while remaining idle. Identify the bottleneck using actual orders and handling records, then compare the expected contribution gain with added recurring and capital costs under a cautious utilization case.
Should failures be fixed costs or variable costs?
Material and occupied time from a reprint generally change with attempts, so they can be modeled as variable expected costs. Repairing a damaged machine can be a separate maintenance or exceptional expense. Choose a consistent boundary and avoid counting the same loss twice. For correlated plate failures, use plate-level evidence rather than assuming every object has an independent failure probability.